Weather and Forecasting
Introduction[edit]
Weather is the single most important factor in determining whether it’s safe to enter a canyon. And for canyoneers, the ability to accurately interpret a forecast is extremely important. But to do that, we need to better understand a few fundamental things about how forecasts work.
Forecast Metrics vs. Forecast Scope[edit]
There are many different kinds of forecasts, and what they contain can vary widely. Some are extremely simple, while others are packed with data. Forecasts may include all sorts of different metrics—temperature, cloud cover, wind, chance of rain, expected precipitation totals, and more. What’s included, and how it’s presented, can differ depending on the source, platform, or provider.
But these weather metrics—however detailed—are only meaningful if they’re understood in context. Every forecast depends on two other elements that are not metrics themselves, but are essential to interpreting them: where the forecast applies and when it applies. Together, these form the scope of the forecast.
If you don’t know where or when a forecast is valid, all the metrics it contains are essentially useless. A 30% chance of rain might sound fine—but if that number applies to a different region than the canyon you’re planning to enter, or a different part of the day, then that forecast isn’t telling you what you think it is. Without clearly defined time and location boundaries, even the best forecast can be dangerously misleading.
This distinction between metrics and scope is important. The metrics describe what conditions are being predicted. But those predictions only make sense when anchored to the correct place and timeframe. As canyoneers, we need to be able to identify both aspects in every forecast we read.
Why General Forecasts Fall Short[edit]
Most public forecasts are designed for simplicity. If you’re deciding whether to wear a jacket, bring an umbrella, or plan a picnic, you don’t need a detailed breakdown of when and where conditions might change. You just want a general idea—and general forecasts are built to deliver exactly that. They’re intentionally broad, quick to read, and easy to interpret without much thought.
But in canyoneering, that simplicity becomes a problem. The language in general forecasts is often vague, averaged, or generalized across large areas and long time windows. A phrase like “20% chance of showers in the afternoon” might sound mild—but it could refer to a six-hour block and a geographic zone that covers dozens of miles, multiple elevations, and several different types of terrain.
That’s not nearly precise enough for evaluating canyon-specific risk. When flash flooding is a concern, we need to know exactly where rain might fall, how much is expected, and when it's most likely to happen. Terms like "afternoon" or "in your area" may sound casual, but they often have specific technical definitions—and interpreting them correctly depends on understanding the scope of the forecast.
To use forecasts effectively, we need to go beyond the surface. We need to understand what information is included, what isn’t, and how to identify the parts that actually matter for canyon travel. That includes recognizing the role of forecast metrics *and* the time and location frames that give those metrics meaning.
The pages that follow will break down the key components of forecasts, explain how to locate and interpret the details that matter most for canyon travel, and help build a more confident, canyon-aware approach to evaluating weather risk.
Note: This page is somewhat U.S.-centric, referencing forecast data from the [National Weather Service](https://www.weather.gov/) and [National Oceanic and Atmospheric Administration](https://www.noaa.gov/). However, the core principles apply no matter where you’re getting your forecast.
Forecast Area[edit]
Every forecast, regardless if it is stated as a vague region or with clearly defined boundaries, is tied to a geographic area. Without knowing where a forecast applies, it is impossible to use it meaningfully. In everyday life, a reference to a town like “Hanksville” or “Escalante” might feel intuitive—you just assume it means somewhere around that place. For canyoneering, though, that kind of assumption is not good enough. Terrain, elevation, and watershed boundaries do not line up neatly with civic names, and relying on them can give a false sense of accuracy. We need more precision.
The National Weather Service uses two main types of areas:
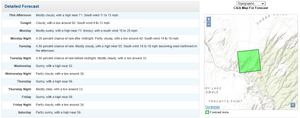
- Point forecast: A 5 km × 5 km grid cell. Clicking on a location in the NWS map highlights the cell and provides the forecast specific to that point.
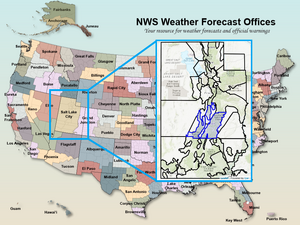
- Forecast zones: Larger areas defined by the NWS, often aligning with counties or groups of smaller zones. For example, Salt Lake County is its own forecast zone, while the “Wasatch Back” combines multiple zones. Zone forecasts may be derived from the collection of grid cells that make up the area.
These zones are not vague labels—they are official, mapped boundaries:
Time Period[edit]
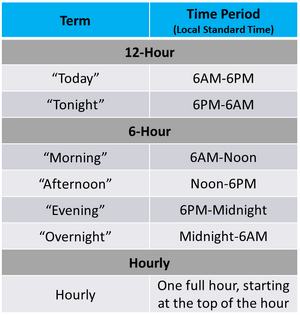
Every forecast specifies not only what may happen but also when it may happen. Terms like “afternoon,” “overnight,” or “morning” may sound intuitive and casual, but they are more precise than most people realize. The National Weather Service (and many other providers) uses these terms within a standardized system, each tied to specific time windows.
Forecasts are stated in local time unless otherwise noted. Some specialized forecast products may instead be issued in Zulu time (UTC), but general forecasts for the public are almost always given in local time.
- 12-hour periods:
- "Today" – 6:00 a.m. to 6:00 p.m.
- "Tonight" – 6:00 p.m. to 6:00 a.m.
- 6-hour periods:
- "Morning" – 6:00 a.m. to 12:00 p.m.
- "Afternoon" – 12:00 p.m. to 6:00 p.m.
- "Evening" – 6:00 p.m. to 12:00 a.m.
- "Overnight" – 12:00 a.m. to 6:00 a.m.
- Hourly forecasts: Refer to the hour beginning at the stated time (e.g., “3:00 p.m.” means from 3:00–4:00 p.m.).
Forecast Metrics[edit]
The metrics included in a forecast vary depending on the source, and not all of the ones listed below will appear in every forecast. The following are some of the most common. Click the links to learn more about each metric and how to interpret them effectively.
- Probability of Precipitation (POP): The chance of measurable precipitation, typically expressed as a percentage.
- Temperature: Expected highs and lows for the time period.
- Sky State: How cloudy or clear the sky is expected to be, using terms like “partly cloudy,” “overcast,” or “sunny.”
- Wind: Direction and speed, sometimes with qualifiers like “breezy” or “gusty.”
- Relative Humidity: Expressed as a percentage.
- Dew Point: Expressed in relation to temperature.
- Barometric Pressure:
- Thunder/Lightning Probability: How likely thunder or lightning will accompany a storm.
- Precipitation Type: Specifies the form of precipitation—rain, snow, hail, or a mix—when relevant.
- Quantitative Precipitation Forecast (QPF): The estimated amount of precipitation. This is not always shown in everyday forecasts but is available through NWS and similar sources.
Additional Forecast Products and Tools[edit]
When we talk about “the forecast,” most people think of the daily or hourly prediction they read or listen to—something that tells them the chance of rain, expected temperatures, or whether it’ll be windy. But that’s just one type of forecast product among many. The National Weather Service and other providers produce a wide range of tools and products that go beyond the basic forecast. Some help predict future conditions; others help us assess what's happening right now. These additional resources—things like radar, satellite imagery, advisories, and watches—don’t replace the forecast, but they provide valuable context.
Some of these tools can also help us evaluate a forecast as the event window approaches. Forecasts are predictions—but predictions don’t always play out exactly as expected. By using real-time tools, we can begin to see whether current conditions are unfolding in line with what was forecast, or if they’re beginning to diverge. Not every tool serves this function, but many do, and they can offer important clues about whether a forecast is holding or shifting.
By combining what the forecast says might happen with tools that show what is happening, we can make better-informed decisions in real time—and gain a more complete picture of current and developing weather conditions.
- Fronts:
- Weather Surveillance Radar: Available to the public to view the current and recent state of the weather in a given area.
- Weather Imagery:
- Weather Advisories:


